IRRV Alert - week ending 16th August 2019
Information Letters
News
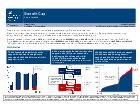
Benefit Cap: number of households capped to May 2019 (13 August 2019)
Official Statistics
Benefit Cap: number of households capped to May 2019
Statistics on households that have had their benefits capped between 15 April 2013 and May 2019.
Documents

Details
This Department for Work and Pensions (DWP) publication shows the number of households that had their Housing Benefit capped from 15 April 2013 to May 2019.
Explore the statistics with our interactive tools
Find further breakdowns of benefit cap statistics in Stat-Xplore, an online tool for exploring some of DWP’s main statistics. You can use Stat-Xplore to create your own tables and charts.
View an Interactive dashboard of key benefit cap statistics by region. Select a region to see the number and family make-up of capped households and the outcomes for households that have moved off the cap.
Publication frequency
The DWP statistics team are reviewing the frequency of their publications with a view to reduce the number of releases each year. This will enable them to direct efforts into development of the statistics and the expansion of the scope and content of the publications.
For this release the proposal is to reduce the current publication frequency from every 3 months to every 6 months. The 3 monthly data would still be available but would only be released every 6 months.
Please let us know:
- Do you support the reduced frequency of release? If not, please tell us why this would affect you as a user of the statistics. Please be specific in providing your reasons.
- What are the best months to publish? Please let us know if you use the published data for any other publication or to make a decision that happens at a particular time in the year.
Please email your feedback to stats-consultation@dwp.gpn.gov.uk, stating ‘Publication Frequency’ in your subject.
Please reply by 8 October 2019.
The statistics team appreciate your input and collaboration in this review.
More information
Read the background information and methodology publication for more information.
Last updated 13 August 2019 + show all updates