IRRV Alert - week ending 7th August 2020
News
Reports
Benefit cap: number of households capped to August 2019 (6 August 2020
Official Statistics
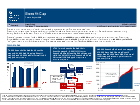
Benefit cap: number of households capped to August 2019
Statistics on households that have had their benefits capped between 15 April 2013 and August 2019.
Published 7 November 2019
Last updated 6 August 2020 — see all updates
From:
Department for Work and Pensions
Applies to:
Wales, England, and Scotland
Documents
Benefit cap quarterly statistics: GB households capped to August 2019
PDF, 516KB, 16 pages
This file may not be suitable for users of assistive technology. Request an accessible format.

Tables: Benefit cap quarterly statistics: GB households capped to August 2019
ODS, 546KB
This file is in an OpenDocument format
This file may not be suitable for users of assistive technology. Request an accessible format.
Details
The latest release of these statistics can be found in the benefit cap statistics collection.
This Department for Work and Pensions (DWP) publication shows the number of households that had their Housing Benefit capped from 15 April 2013 to August 2019.
Explore the statistics with our interactive tools
Find further breakdowns of benefit cap statistics in Stat-Xplore, an online tool for exploring some of DWP’s main statistics. You can use Stat-Xplore to create your own tables and charts.
View an Interactive dashboard of key benefit cap statistics by region. Select a region to see the number and family make-up of capped households and the outcomes for households that have moved off the cap.
Publication frequency
The review about the frequency of publication of these statistics is now closed and we are analysing your feedback. Findings will be published soon and these will outline any changes to the frequency of publication.
More information
Read the background information and methodology publication for more information.
Published 7 November 2019
Last updated 6 August 2020 + show all updates